
Summary Metrics
This section displays key network metrics, including:
- Total / Installed: Count of total devices and installed devices
- Not Reporting: Count of devices with no meter readings in the past 3 days
- Active Alarms: Count of devices reporting alerts within the past 7 days
- Batteries < 50%: Count of devices with battery level < 50%
The metric cards can also be used to filter the Interactive Map / list view. The current active filter is indicated by the green bar.

Additionally, two filters are present to further slice the metrics:
- Protocols: Select Sidewalk, LoRaWAN, or All Protocols to filter to the device network.
- Devices: Select All Devices or Installed Devices.
Metrics are updated daily. To request the latest data up to the previous system hour, click Generate Metrics. Check if new metrics are ready by refreshing the page or clicking the Refresh button beside Generate Metrics. In general, metrics take approximately 2-3 minutes to generate. After the update is complete, the header text will update indicating when the summary was last calculated.
Interactive Network Map
The Network Map allows you to visualize the devices in your network. The shape indicates the device’s network, and the color range indicates device status based on core health metrics. You can switch between list or map view by clicking on the view toggle button. Devices displayed are affected by the filters selected at the top of the page.
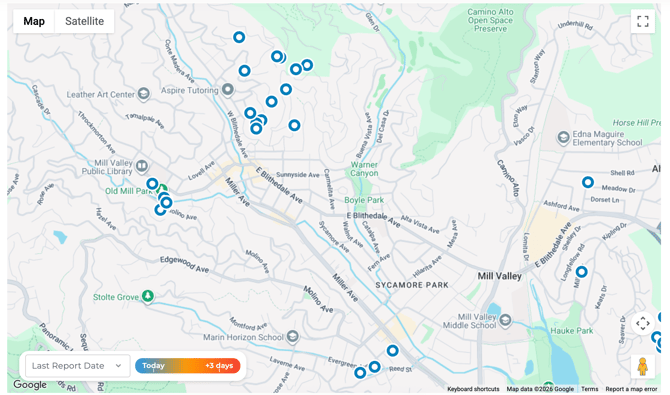
Legend
|
Round indicator ⭕ |
Device set to report on the Amazon Sidewalk network. |
|
Square indicator ⏹️ |
Device set to report on the LoRaWAN network. |
|
|
Last Report Date colors the devices based on the last time the device reported to the Engage platform. |
|
|
Signal Strength colors the devices based on the Received Signal Strength Indicator (RSSI) of the device when it last reported. |
|
|
Battery Level colors the devices based on the battery level of the device when it last reported. |



Network Metrics
This section displays time-series aggregate data of the device fleet’s network data. Hourly data is available for up to 2 weeks, while older ranges display daily data. Data displayed is not affected by the filters selected at the top of the page, and only the in-graph filters affect the data shown.
Available filters: All Devices or Installed Devices, Duration (up to 8 weeks prior)
Delivery Rate
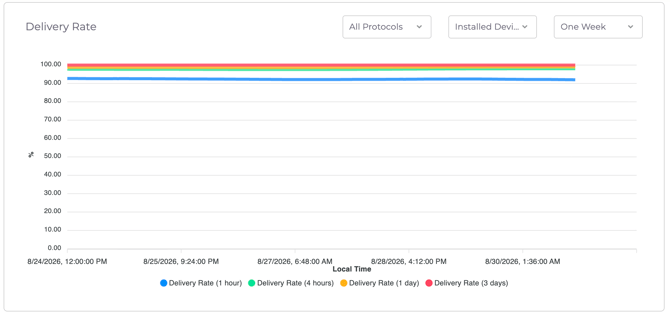
The delivery rate is the rate of successful meter reads of the entire fleet over a 7-day lookback period, and is calculated by taking the sum of successful meter reads divided by the expected successful meter reads in that particular time period. Delivery Rates can also be filtered by network protocol. There are 4 aggregations available for delivery rates:
|
1-hour |
Success rate for hourly meter readings over a 7-day lookback period. For example, if you have a device fleet of 10 devices, and you want to calculate the 1-hour delivery rate at October 27th 00:00, the 1-hour delivery rate is 100% if all 10 devices reported a successful meter reading every hour from October 20th 00:00 to October 26th 23:59. It would be 50% if exactly half the devices reported every hour and the other devices did not report at all, or if all devices reported every 2 hours. |
|
4-hour |
Success rate for meter readings at least once every 4 hours over a 7-day lookback period. In the same manner as how the 1-hour delivery rate is calculated, the system will show a 4-hour delivery rate of 100% for October 27th 00:00 if all devices reported a successful meter reading at least once every four hours from October 20th 00:00 to October 26th 23:59. An individual device is considered to have achieved a 4-hour delivery if it reports at least once in any rolling four-hour period. |
|
1-day |
Success rate for daily meter readings over a 7-day lookback period.The system will show a 1-day delivery rate of 100% for October 27th 00:00 if all devices reported a successful meter reading at least once a day from October 20th 00:00 to October 26th 23:59. An individual device is considered to have achieved a 1-day delivery if it reports at least once in any rolling twenty-four-hour period. |
|
3-day |
Success rate for meter readings at least once every 3 days over a 7-day lookback period.The system will show a 3-day delivery rate of 100% for October 27th 00:00 if all devices reported a successful meter reading at least once every 3 days from October 20th 00:00 to October 26th 23:59. An individual device is considered to have achieved a 3-day delivery if it reports at least once in any rolling 72-hour period. |
What am I looking for?
- Flat lines indicate a stable network.
- Lines that are close together between 90% and 100% indicate a strong network.
- Lines that are diverging suggest attention may be needed:
- 1-day starting to trend lower than 3-day: Leading indicator that billing windows could be at risk.
- 4-hour starting to trend lower than 1-day: Leading indicator of device or network trouble.
Alarm Rate
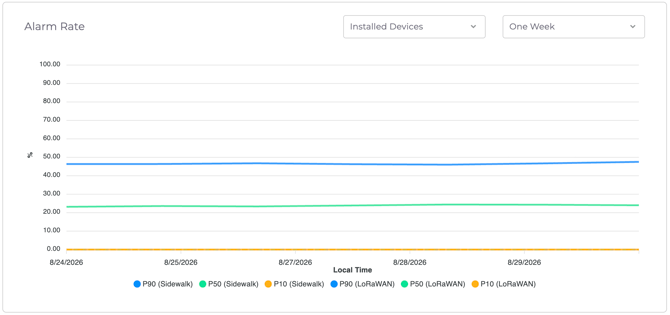
Indicates how frequently alerts occur (e.g., low battery, communication errors). The alarm rate is the rate of alerts received from the entire device fleet over a 7-day lookback period. This metric is calculated by taking the sum of alerts received divided by the total number of device readings and alerts received in that particular time period. There are 3 aggregations available for alarm rates: P90, P50, and P10, representing the 90th, 50th, and 10th percentile of alarm rates across the fleet.
What am I looking for?
- A P10 line increase indicates a few devices are behaving out of range, and the Alarm History table should be reviewed carefully to prevent growing issues.
- If all three lines are increasing together, it indicates a broader portfolio pattern.
Battery Level
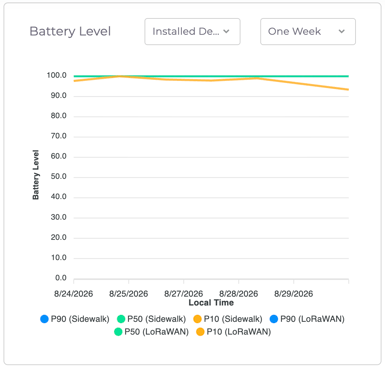
Shows the overall distribution of device battery levels, available at the 90th, 50th, and 10th percentiles. The minimum battery level is calculated if more than one level is available for a particular hourly period, and aggregations take the minimum.
What am I looking for?
- Consistently high and stable percentile values indicate good battery health across the fleet
- Percentile values trending downward quickly indicate battery health issues across the fleet
RSSI
Received Signal Strength Indicator (RSSI) reflects communication signal strength. While not always meaningful on its own, RSSI trends can help explain fluctuations in delivery, alarm, or battery metrics. Available at the 90th, 50th, and 10th percentiles.
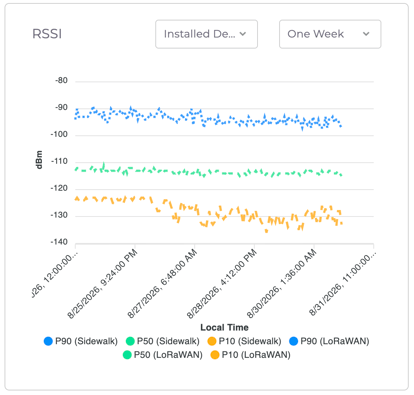
What am I looking for?
- Consistently high and stable percentile values indicate good signal strength across the fleet
- Wild swings of any percentile line, especially trending lower, should prompt review of the Alarm History table
Alarm History Table
The Alarm History Table displays all alerts received from your device fleet over the past 7 days, including lagging indicators from previous alarms for visibility. This list of alarms can be exported to CSV. For a full run down of the alarm definitions, view the Alarm Definitions article.